An ETF portfolio tracker for every account that holds your funds
Index funds in a brokerage account, more in a retirement account, maybe a crypto ETF. Sonar puts every ETF and fund in one portfolio and shows how they've done together.
Updated October 26, 2026
ETF investing tends to be simple until the accounts multiply. The same index fund ends up in two places, a bond fund sits in an old plan, and no brokerage shows how much of your money is really in each fund. Sonar adds them up across accounts and keeps the total current.
What it tracks
- ETFs and mutual funds in any brokerage account, next to individual stocks if you hold them.
- The same fund across accounts, shown per account and as one combined weight.
- Cash in connected brokerage accounts.
- Crypto, if you hold some, in the same portfolio. See the crypto and stock portfolio tracker.
Fund prices refresh through the US trading session. Each holding is matched to a listed fund; one Sonar doesn't recognize yet, such as a recently launched ETF, is kept and labeled as not recognized instead of being guessed at.
Getting your funds in
- Connect a brokerage (Starter, Standard and Premium). Through Plaid, at US institutions, signed in on your broker's own screens. Holdings come in with cost basis where your broker provides it, along with buys, sales, dividends and fees, and resync every 6 hours. Investment accounts come in, including retirement accounts where your institution offers them through Plaid. See the brokerage portfolio tracker.
- Import a CSV. Most brokers let you download positions as a CSV. Upload it, check the symbol and quantity columns, and include cost basis if the file has it. See importing a portfolio CSV.
- Add funds by hand. Search the ticker or the fund's name, enter the number of shares and, optionally, the total cost.
What you see
Performance you can compare
Your portfolio's performance is time-weighted, so regular contributions don't inflate it. Put it next to the S&P 500 (SPY) or Bitcoin on the same chart to see how your mix has done against a single index. The comparison line is price only, without dividends, and the chart says so.
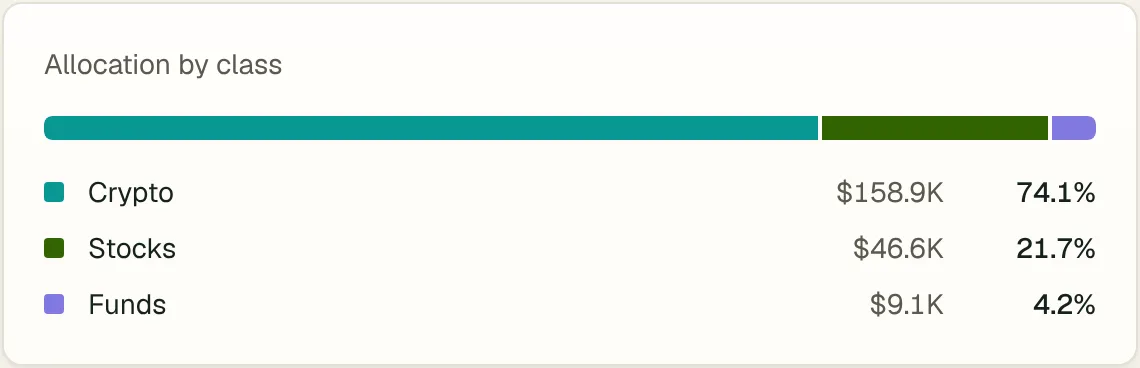
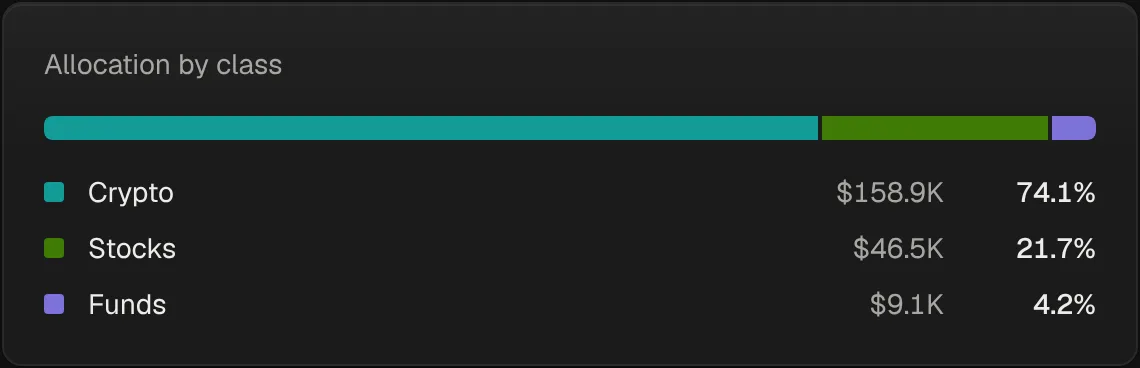
Allocation by fund, class and account
See what share of your portfolio each fund makes up, how it splits between funds, stocks, cash and crypto, and how much sits in each account. Filter your holdings to one account or several.
Gains and income
Unrealized profit or loss for each fund, realized gains over the last 12 months at average cost per account, and dividends and interest from connected brokerages and imported histories.
A page for each fund
Price history, your position over time and every transaction you've made in it.
See a sample portfolio with live prices first.
What it doesn't do
Sonar shows each ETF as one holding. It doesn't break funds down into the stocks inside them, and it doesn't compare expense ratios or screen for new funds. It tracks what you already hold.
Market context and alerts
On Starter, each fund and stock you hold shows social data and a week of news, and you can set your own price levels. On Standard and Premium, AI alerts also email you about unusual price moves and major stories for anything you own. Alerts report what happened; they don't advise.
Ask Claude or ChatGPT about your ETFs
Connect Sonar's read-only MCP connector and ask in plain language. On Standard:
What share of my portfolio is in index funds, and how is that split across my accounts?
How has my portfolio done this year compared with the S&P 500?
Setup is on Developers; the AI portfolio tracker page covers what the assistant can see.
Read-only and private
Brokerage connections request investment data only: no trading, no money movement, and your password never reaches Sonar. Access tokens are encrypted, your portfolio is isolated at the database level, and your data is never sold. Disconnecting revokes access at Plaid. Details on the security page.
Pricing in brief
Free covers the portfolio, live prices, manual entry and CSV import. Starter ($7 a month) adds brokerage connections, social data, alerts and AI tools for market data. Standard ($11 a month) adds your full portfolio in AI tools. Yearly billing saves up to 20%. See pricing.
FAQ
Can I track ETFs for free?
Yes. Add funds by hand or import a CSV on Free and see live prices, performance and allocation. Connecting a brokerage needs Starter, Standard or Premium.
Does it track mutual funds too?
Yes. Mutual funds are tracked alongside ETFs and stocks.
Are European ETFs supported?
Sonar prices the funds in its asset list, and fund prices follow the US trading session. A fund it doesn't recognize is kept and flagged rather than priced by guesswork.
Can I see the stocks inside my ETFs?
No. Each fund is shown as a single holding, with its own price chart and your position in it.
Related pages
- Stock portfolio tracker with live prices and P&LA stock portfolio tracker for stocks, ETFs and funds. Connect US brokerages read-only or import a CSV, then see performance, dividends and allocation.
- Brokerage portfolio tracker across all your accountsConnect US brokerage accounts read-only through Plaid and see stocks, ETFs and funds together, with trades, dividends and cost basis synced every 6 hours.
- How to track asset allocation across crypto and stocksMeasure how your money is split across stocks, ETFs, crypto and cash, spot concentration and drift, and keep an honest view of diversification.
- How to calculate your portfolio return (TWR vs MWR)Simple, time-weighted and money-weighted returns explained with worked examples, so deposits and withdrawals stop distorting how your portfolio did.
- Snowball Analytics alternative for crypto and stocksSnowball Analytics is built for dividend investors. Sonar tracks crypto, stocks and ETFs together, with self-custody wallets and social data on every holding.